Using Technical Indicators in Trading: An Overview of the Relative Strength Index (RSI)
The Relative Strength Index (RSI) is a technical indicator used by traders to measure the strength of an asset's price action. The RSI is a momentum oscillator that ranges from 0 to 100 and is calculated by comparing the average gains and losses over a given period of time. The RSI is a popular tool used by traders to identify overbought and oversold conditions, as well as potential trend reversals. In this article, we will explain the RSI in more detail and provide an example of how it can be used in trading.
Calculation of RSI The RSI is calculated using the following formula:
RSI = 100 - [100 / (1 + RS)]
where RS = Average Gain / Average Loss over a specified time period
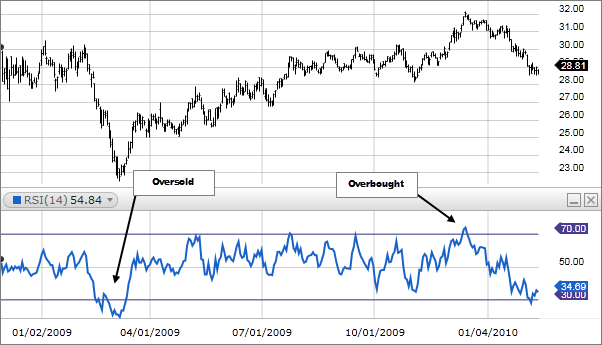
The RSI is typically calculated over a 14-day period, but can be adjusted based on the trader's preference. The RSI is plotted on a scale of 0 to 100, with levels of 70 and above indicating overbought conditions and levels of 30 and below indicating oversold conditions.
Interpretation of RSI
When the RSI is above 70, it is considered overbought, and when it is below 30, it is considered oversold. When the RSI is overbought, it suggests that the asset may be due for a correction or a trend reversal. Conversely, when the RSI is oversold, it suggests that the asset may be due for a bounce or a trend reversal.
Traders use the RSI in combination with other technical indicators to identify potential buying and selling opportunities. For example, if the RSI is showing an overbought condition, and a bearish candlestick pattern forms, it may be a signal to sell. Conversely, if the RSI is showing an oversold condition, and a bullish candlestick pattern forms, it may be a signal to buy.
Example of RSI in Trading
Let's take a look at an example of how the RSI can be used in trading. In this example, we will use the daily chart of the EUR/USD currency pair.
Step 1: Set up the chart
To begin, we need to set up our chart. We will use a daily chart of the EUR/USD currency pair and add the RSI indicator to our chart. We will set the RSI to a 14-day period, as this is the most common setting used by traders.
Step 2: Identify the trend
The first step in using the RSI is to identify the trend. In our example, we can see that the EUR/USD currency pair is in a downtrend, as evidenced by the lower highs and lower lows.
 |
| Using Technical Indicators in Trading: An Overview of the Relative Strength Index (RSI) |
Step 3: Look for overbought and oversold conditions
Next, we need to look for overbought and oversold conditions. As we can see on the chart, the RSI has crossed below the 30 level, indicating that the EUR/USD currency pair is oversold. This may be a potential buying opportunity.
Step 4: Confirm the signal
Before entering a trade, we need to confirm the signal. In this example, we can see that a bullish divergence has formed between the RSI and the price action. This is a strong indication that the downtrend may be coming to an end, and a potential reversal may be in the works.
Step 5: Enter the trade
Once we have confirmed the signal, we can enter the trade. In this example, we would enter a long position in the EUR/USD currency pair, with a stop loss set below the recent low.
Step 6: Manage the trade
Finally, we need to manage the trade. In this example, we can see that the EUR/USD currency pair has started to move higher, confirming our bullish divergence signal. We can use the RSI to help us manage the trade by watching for overbought conditions. As the EUR/USD currency pair moves higher, the RSI will eventually cross above the 70 level, indicating that the asset is overbought. At this point, we may want to consider taking some profits or tightening our stop loss to lock in some gains. We can also use the RSI to help us identify potential exit points. For example, if the RSI starts to move lower and crosses below the 70 level, it may be a signal to exit the trade. Alternatively, if the RSI starts to move sideways or consolidates, it may be a signal to hold onto the trade and wait for further confirmation of a trend reversal.

